hacklink
hack forum
hacklink
film izle
hd porno
deneme bonusu veren siteler
vaycasino
vaycasino giriş
vaycasino
บาคาร่า
sahabet
sheratonbet
anadolu escort
bypuff.com
casibom
casibom
jojobet
portobet
Casibom
bahis siteleri
onwin
holiganbet
holiganbet
sekabet
jojobet
casibom
kulisbet
paribahis
vaycasino giriş
1xbet
casibom
tipobet
tipobet
betnano
jokerbet
royalbet
casinoroyal
jojobet
Deneme bonusu
Gamdom
Betpuan
Vdcasino
Dinamobet
tipobet
casibom
Grandpashabet
vaycasino
meritking
meritking giriş
sex hattı
sex hattı
setrabet güncel link
setrabet heylinkme
ultrabet
casibom
marsbahis
casibom
test
Yakabet
Menu
Home
Topics
My Insights
About
Contact
Login
Sign Up
Topics
My Insights
Login
Sign Up
Topics
>
Statistics and Probability
>
Statistics
>
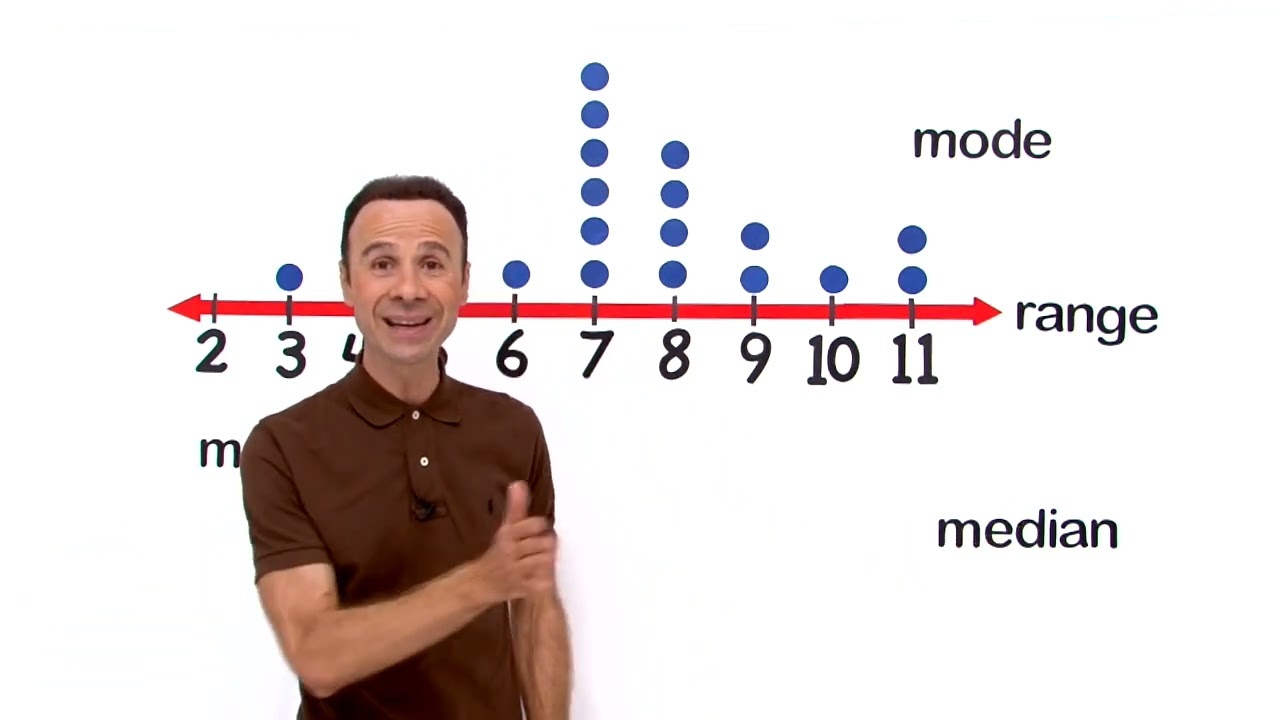
Create and Interpret Dot Plots (Line Plots)
Create and Interpret Dot Plots (Line Plots)
Try
VividMath Premium
to unlock full access
Start Free Trial
Create and Interpret Dot Plots (Line Plots)
Video Quiz 1
Video Quiz 2
Create a Dot Plot from a Set of
Scores #1
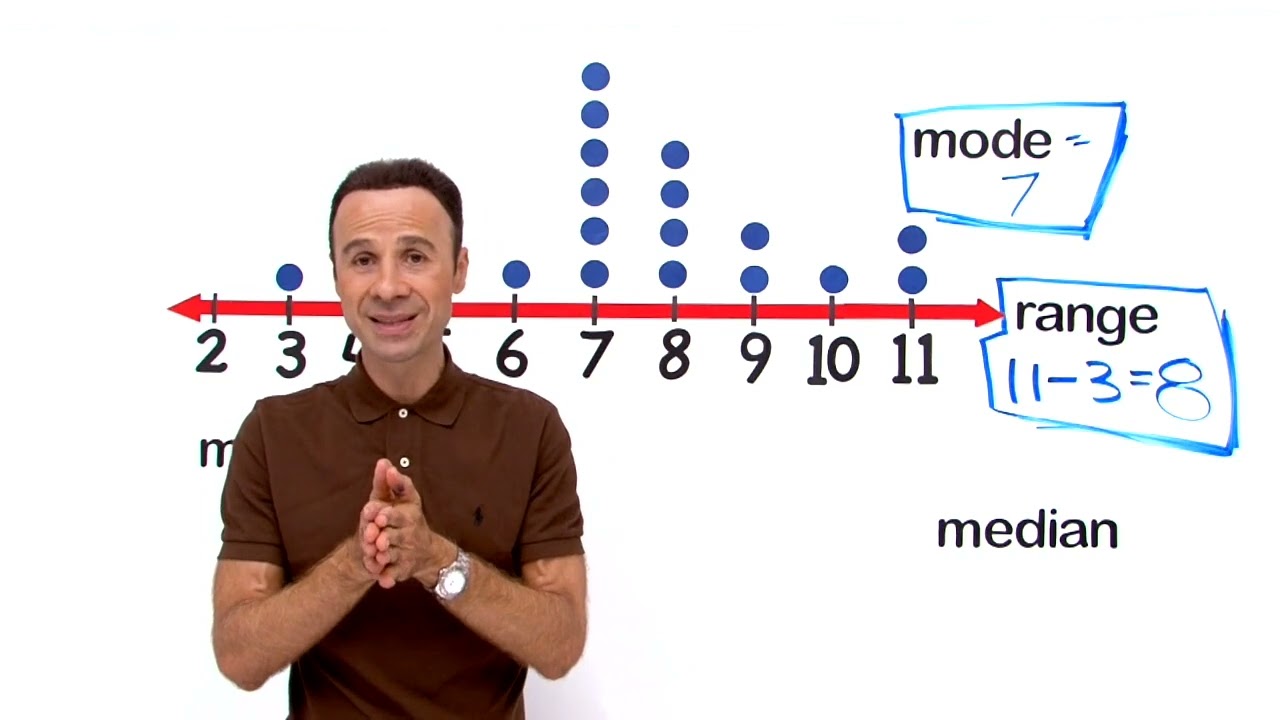
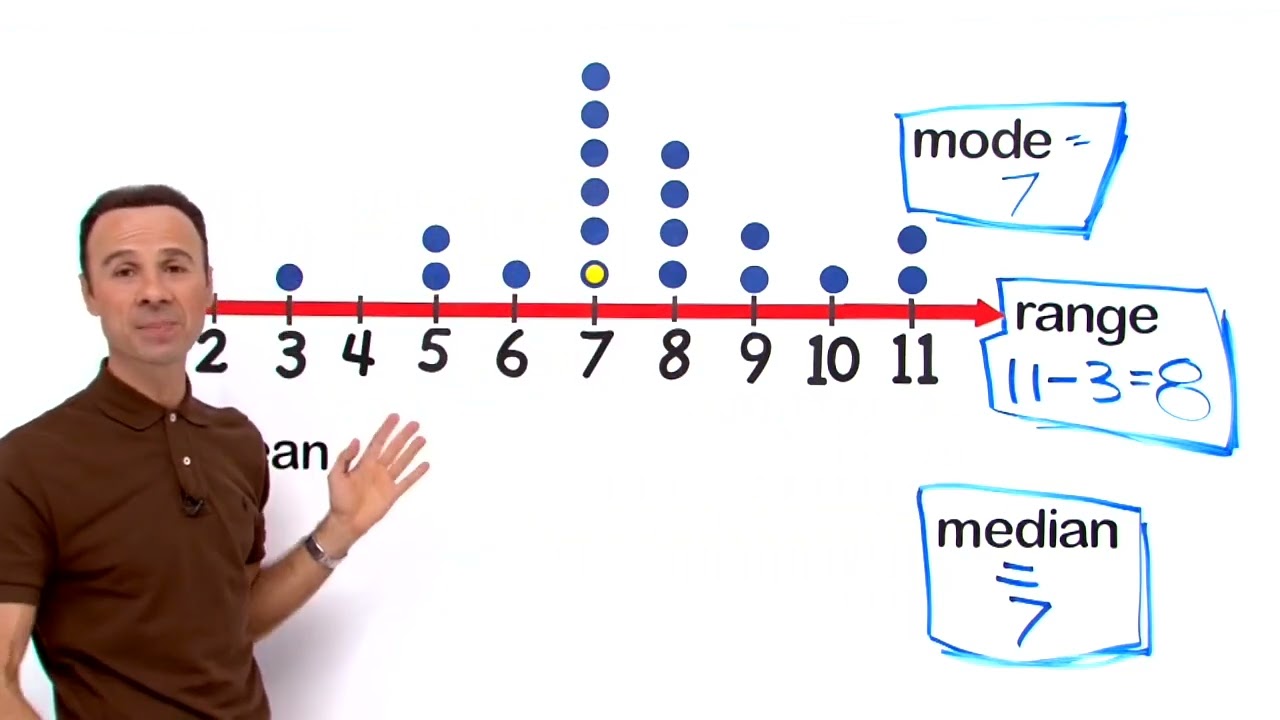
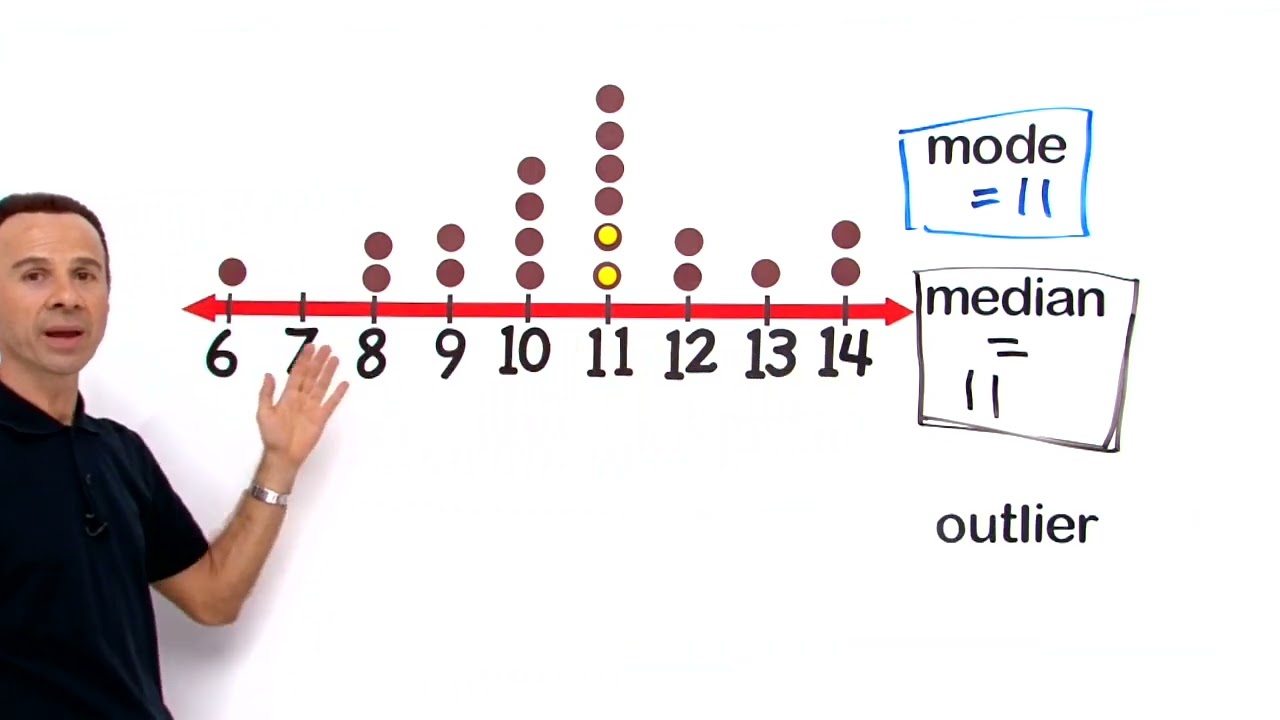
Find the Mode from a Dot
Plot #1
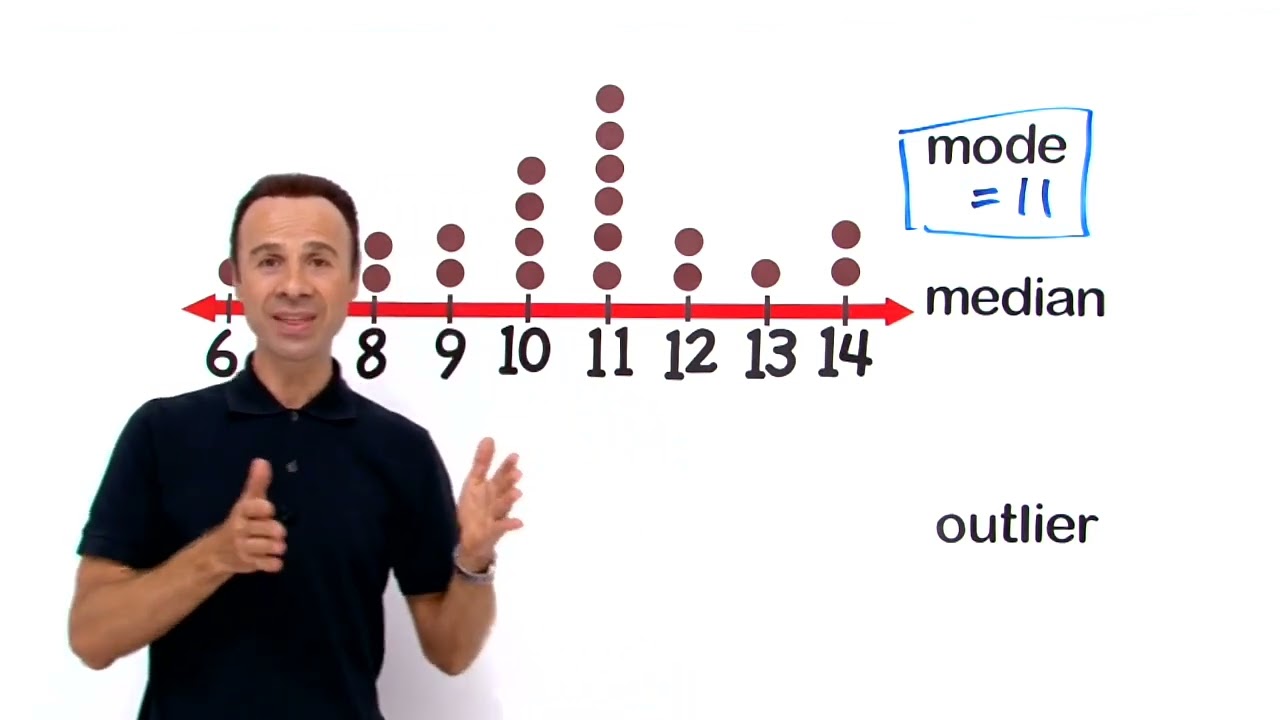
Find the Mode from a Dot
Plot #2
Find the Range from a Dot
Plot #1
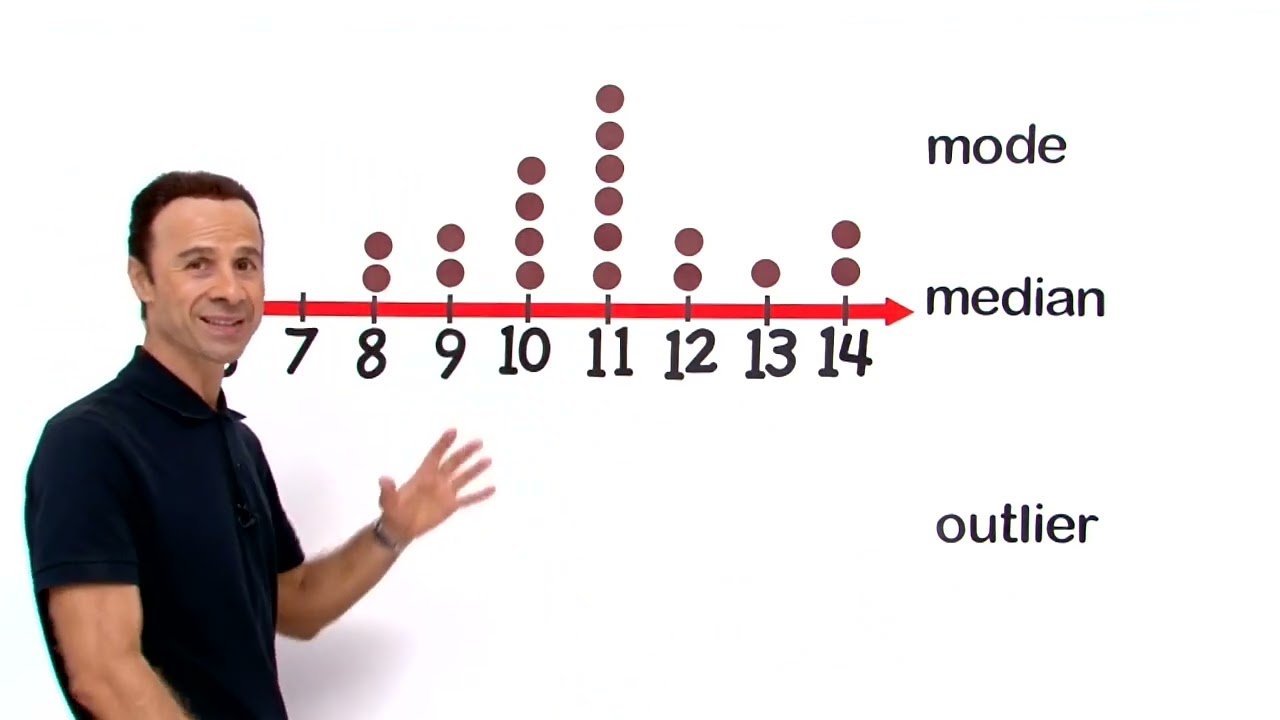
Find the Median from a Dot
Plot #1
Find the Median from a Dot
Plot #2
Find the Mean from a Dot
Plot #1
Find the Outlier from a Dot
Plot #1